
Visual Data Trellis Charts
safenonpoisonousdetected
- type:Productivity Software
- Version:v1.1
- size:0MB
- update time:2025-05-09 20:48:35
tag:
Hot collection
List recommendation
- introduction
- picture
- Boutique
- Related
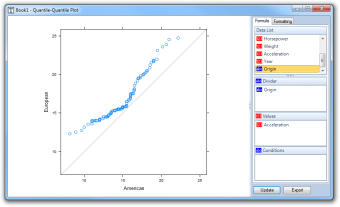
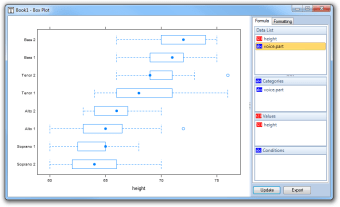
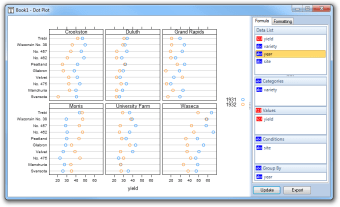
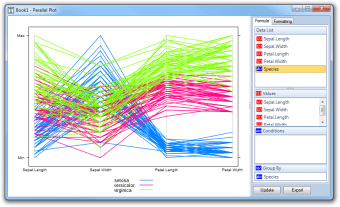
Developer's DescriptionBy The Visual Data GroupCreate clear Excel charts to enhance your ability to analyze large amounts of data.Visual Data Trellis Charts adds eight new chart types previously unavailable in Excel. These include Parallel Plots, Box Plots, and Dot Plots. Users will also be able to create trellis chart layouts allowing them to analyze many pieces of data at the same time in a clear and effective manner. Visual Data Trellis Charts integrates the modern charting capabilities of R with the familiar interface of Excel. It works by running R commands on your Excel data and displaying the resulting chart. Most importantly, it is fast and easy to use.
Screenshot group

Boutique recommendation


Related recommendation
Ranking in this category


more type
- Game information
- Walkthrough
- Exclusive to girls
- Exclusive for boys
- Mobile game assistance
- Legendary game
- Xianxia game
- Business development
- physical exercise
- Card game
- Racing car racing
- Take risks to solve puzzles
- Break through the barrier
- Leisure puzzle
- Strategic tower defense
- Shooting gun battle
- Cosplay
- Utilities & Tools
- Travel
- Security Software
- Screensavers & Wallpaper
- Productivity Software
- Multimedia
- Internet Software
- Games
- Entertainment Software
- Educational Software
- Developer Tools
- Communications
- Browsers
latest update

Microsoft Office Professional Plus 2013
examine
Free Excel Password Recovery
examine
Microsoft SharePoint Designer 2007
examine
Autodesk AutoCAD Civil 3D
examine
Microsoft Word 2013
examine
Microsoft Office Professional Plus 2010 (64-bit)
examine
WPS Office Premium
examine
Microsoft Mathematics (64-bit)
examine
Emoji Keyboard
examine